
Cooling towers fail quietly.
Optima Tower AI reads a tower’s thermal and water data continuously, then tells your team what to do about it. Industrial IoT, from the sensor on the plant floor to the dashboard on a phone.
By the time you notice, it has cost you.
Cooling tower management still runs on manual testing and reactive repair. Someone takes a sample, sends it off, and acts on the result days later. By then scaling or corrosion has already taken efficiency out of the system, and the tower has been burning energy to stand still.
None of that shows up as a failure. It shows up as a slightly higher bill every month, until something breaks and the plant stops.
Optima Tower AI watches continuously instead, and flags underperformance while it is still cheap to fix.
What it does
Live and historical dashboard
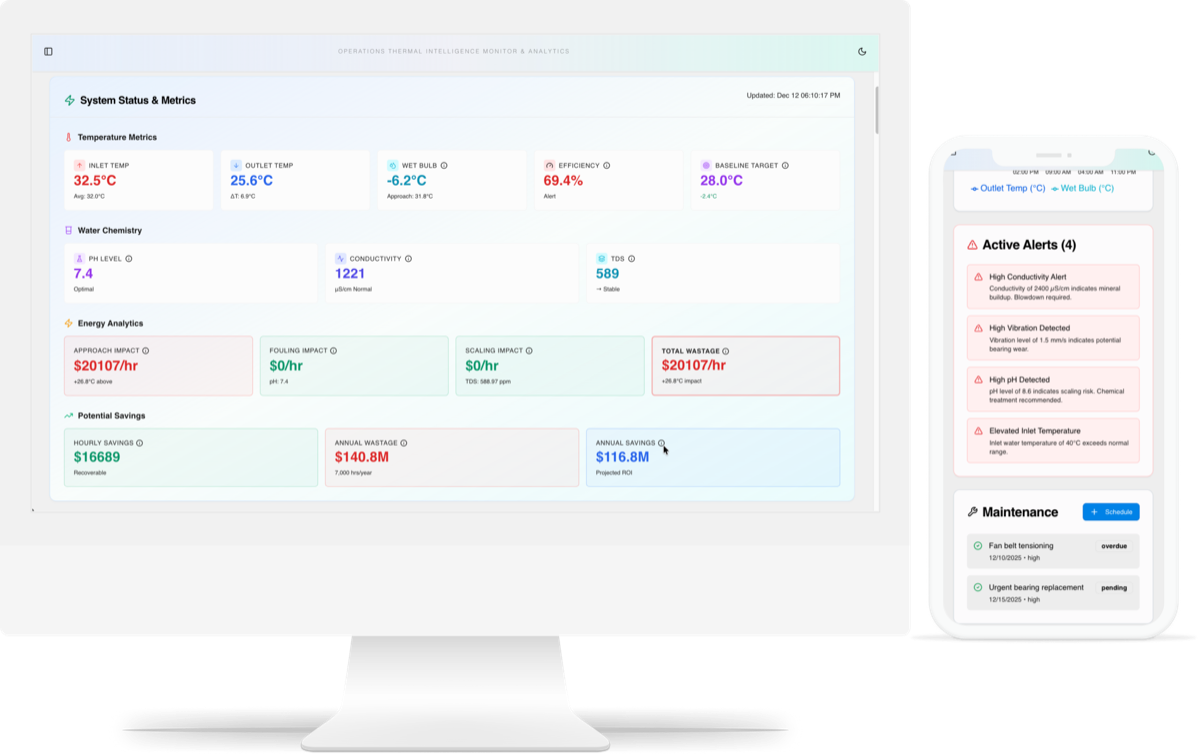
Real-time cooling tower diagnostics and historical trends from any device, mobile or laptop. Inlet and outlet temperature, wet bulb, approach, efficiency and the water chemistry behind them, in one view.
Predictive maintenance guidance
The AI does not just flag an error, it gives the action. “Initiate chemical descaling” or “increase blowdown rate”, with the reading that triggered it, so a technician knows what to do before the call ends.
An edge sensor built for plant floors
A watchdog-protected edge sensor doing high-precision acquisition, designed to drop into existing environments rather than demanding a rebuild around it.
Water, energy and cost reporting
Clear reporting on water quality alongside the energy being wasted, so a maintenance budget can be argued from numbers rather than from instinct.
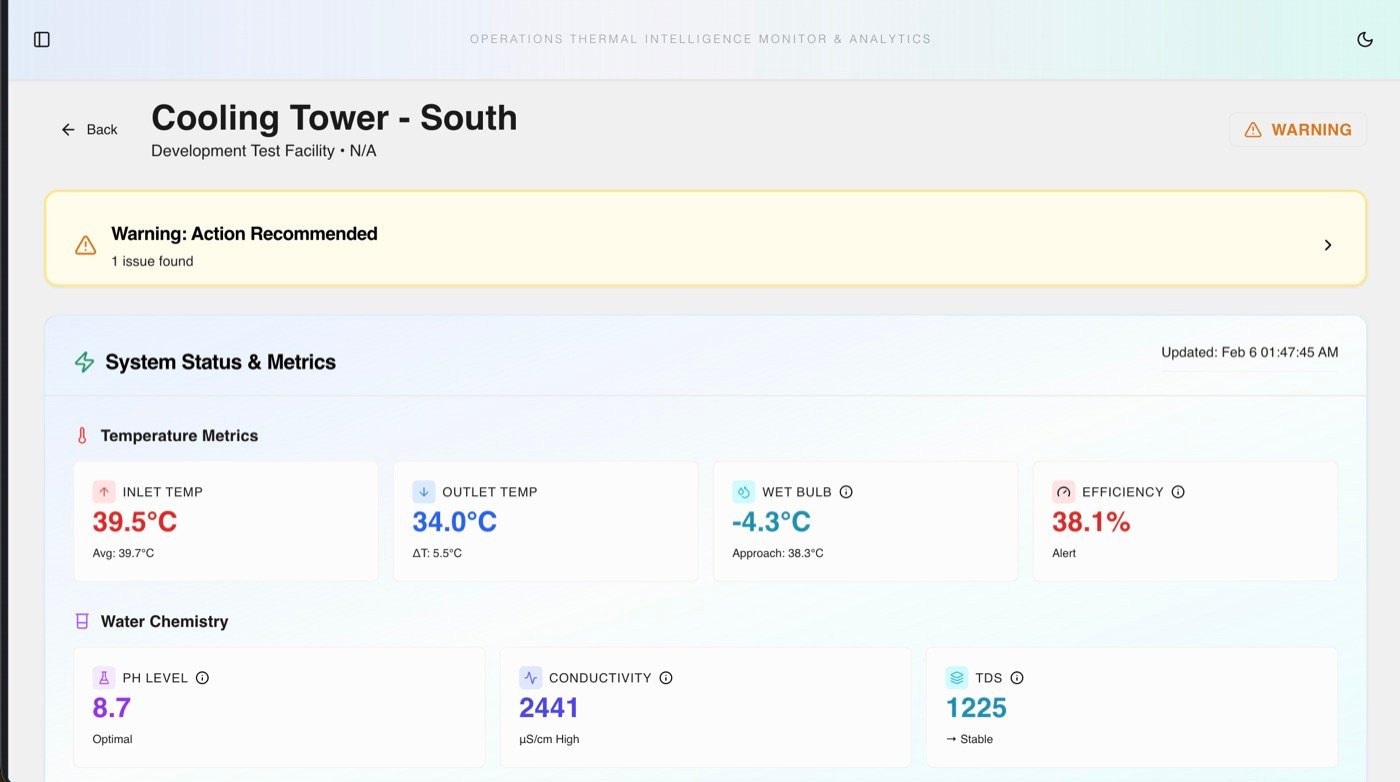
Every reading that matters, and what it means.
Inlet and outlet temperature, wet bulb, approach, delta T, efficiency against a baseline target.
pH, conductivity and TDS, each read against the range that matters for scaling and corrosion.
High conductivity, elevated inlet temperature, pH drift and vibration, each with the recommended response.
Scheduled and overdue work tracked beside the readings that justify it.
What the product targets
Figures published by Optima Tower AI. The energy figure is a potential saving and the downtime figure is a goal, not a measured average.
Hardware and software, one team.
Optima Tower AI spans an edge sensor on a plant floor, a pipeline carrying its readings, a model that interprets them and an interface a maintenance lead opens on a phone. Each part has to hold up for any of it to be worth running.
That is the kind of system we build: industrial IoT where the data has to be right, the advice has to be specific, and nobody is sitting at a desk waiting for a dashboard to load.